Everyone quotes the same LinkedIn outreach numbers.
"30% acceptance rate is solid."
"10% reply rate means your campaign is working."
"Three follow-ups is the sweet spot."
The problem is not the numbers, it’s that most people apply them wrong.
A 28% acceptance rate can mean two completely different things depending on your industry, your targeting approach, and who you are reaching out to.
This blog will tell you what actually moves the three metrics that matter in LinkedIn outreach, what good looks like in each of them, and what we consistently see across SalesRobot campaigns.
What Do the Platform-Wide LinkedIn Outreach Benchmarks Actually Say?
There are three metrics worth tracking in LinkedIn outreach. Most people only track one.
Connection Acceptance Rate: 28-35% Is Your Baseline
This is the percentage of connection requests that get accepted.
For most B2B outreach campaigns, landing anywhere between 28% and 35% is normal. Above 35% usually means your targeting is sharp and your profile is credible.

Below 20% means something is broken, either in who you are targeting, how your profile looks, or the note you are sending with the request.
One thing worth knowing: acceptance rate varies a lot by industry.
A recruiter and a SaaS founder targeting the same seniority level will get very different acceptance rates, not because one is better at outreach, but because their audiences behave differently on the platform. We cover this in the next section.
Connection-Note Reply Rate: Low, and Getting Lower
This is the percentage of people who reply directly to the note attached to your connection request.

Connection-note reply rates have been declining consistently.
If your pipeline depends on people replying to connection notes, it is worth rethinking that approach. The more stable pathway is post-connection messaging, which we get to below.
Message Reply Rate: 20+% Is the Real Target
This is replies to messages sent after the connection is accepted. It is the metric that actually drives pipeline, and it has stayed stable even as connection-note reply rates have dropped.
Good performance on this metric starts at around 35%. Based on SalesRobot campaign data, top-performing campaigns with good targeting and AI personalization regularly hit 50+%.
The three metrics are independent.
Acceptance rate tells you whether people are open to connecting.
Message reply rate tells you whether your follow-up is converting connections into actual conversations.
Does Your Industry Change What "Good" Looks Like?
Yes, significantly.
This is where most people go wrong when benchmarking.
The Industries That Outperform
Recruiting and Staffing consistently leads every metric in LinkedIn outreach. Acceptance rates are higher, note reply rates are higher, and message reply rates are roughly double what most other industries see.
The reason is straightforward: LinkedIn is core to how recruiters work, which means their prospects are more active on the platform and more accustomed to responding to outreach.
Venture Capital, Law, and Professional Services also tend to outperform the average on acceptance rates.
Investors and senior professionals in these fields tend to be open to inbound connections in a way that, say, a mid-level engineer at a SaaS company is not.
The Industries That Underperform
Apparel, Consumer Electronics, Telecommunications, and Media Production tend to sit below average across all three metrics. This does not mean LinkedIn outreach does not work in these sectors. It means you should not benchmark against the platform average and assume your campaign is underperforming.
The Hidden Problem in SaaS and Computer Software
SaaS is the interesting case. Acceptance rates look fine, usually in the 26-28% range. But message reply rates are consistently lower than average. Software buyers accept connections at a normal rate and then do not reply to follow-up messages.
The likely reason is saturation. SaaS buyers are among the most heavily targeted audiences on LinkedIn. They have seen every template, every AI-generated opener, every "I noticed you are scaling your team" message. Generic outreach does not land.
If you are in SaaS, your reply rate target should be benchmarked against other SaaS campaigns, not the platform average. And personalization matters more in this vertical than anywhere else.
Does Sender Seniority Actually Affect Your Results?
Less than people think.
C-Level vs. Manager: The Gap Is Smaller Than You Think
The data consistently shows that sender seniority has very little impact on acceptance rate. C-level, VP, Director, Manager, all land within a few percentage points of each other. The idea that a CEO's name on the request gets meaningfully more acceptances than a Manager's name is not supported by how the numbers actually play out at scale.
There is a slightly higher note reply rate for Director and Senior IC titles, which makes sense. A note from a named specialist feels more relevant than one from a generic title. But even there, the gap is small.
What Actually Moves the Needle Instead
Who you target. How warm the prospect is before the request hits. How relevant your message is to that specific person. How many follow-ups you send and how they are spaced.
These are the variables that separate a 9% message reply rate from a 25% one. Sender title is not one of them. A well-targeted, well-written message from a Manager performs almost identically to the same message from a CEO.
The practical implication: stop limiting outreach to senior senders. Scale it across your team.
Does Company Size Change Your LinkedIn Outreach Performance?
No.
Startups vs. Enterprises: The Gap Is Basically Flat
Across every company size, from solo founders to enterprise teams, acceptance rates and message reply rates land in roughly the same range. A 10-person agency and a 10,000-person enterprise running the same campaign to the same ICP will see similar results.
This is actually good news for smaller teams. You are not at a structural disadvantage because of company size. The playing field is flatter than most people assume.
The Variables Worth Optimizing Instead
Targeting quality. Message relevance. Sequence length. Follow-up timing. Warm-touch approach before the request goes out. These are the things that actually change outcomes, regardless of how big your company is.
What Changed in the Last 12 Months?
Two things stayed stable. One thing did not.
Connection Acceptance: Stable
Acceptance rates have held steady. If anything, well-run campaigns are seeing better acceptance rates than a year ago because more senders have improved their targeting and profile quality. The baseline has not shifted dramatically.
Connection-Note Reply Rate: Declining
This is the one metric that has moved in the wrong direction. Note reply rates are lower now than they were twelve months ago, and the trend is consistent. Generic notes are getting ignored more than they used to be.
The fix is not writing a better generic note. The fix is either making the note hyper-specific to that individual, or skipping the note entirely and relying on post-connection messaging instead.
Message Reply Rate: Flat and Holding
Post-connection message reply rates have stayed stable. This is the metric worth investing in. It has not eroded, and it compounds when you run multi-step sequences, because each follow-up gets another shot at the same reply rate.
What Does a Top-Performing LinkedIn Outreach Campaign Actually Look Like?
Here is a practical scorecard to benchmark against.
The Full Scorecard
These thresholds shift by industry.
For SaaS, expect message reply rates to run 10-15 percentage points below the platform average.
For Recruiting, expect them to run 10-15 points above. Use your industry as the reference point, not the overall table
What Separates Top Performers From the Rest
Who they target. 2nd degree connections accept at significantly higher rates than 3rd degree cold contacts. Premium LinkedIn users accept at rates close to 2nd degree connections, even when they are 3rd degree. Prioritizing these segments in your list makes a measurable difference before you write a single word of copy.
Warm-touch before the request. Following a prospect, liking a post, or commenting before sending the connection request moves acceptance rates on cold 3rd degree contacts meaningfully higher than sending cold.
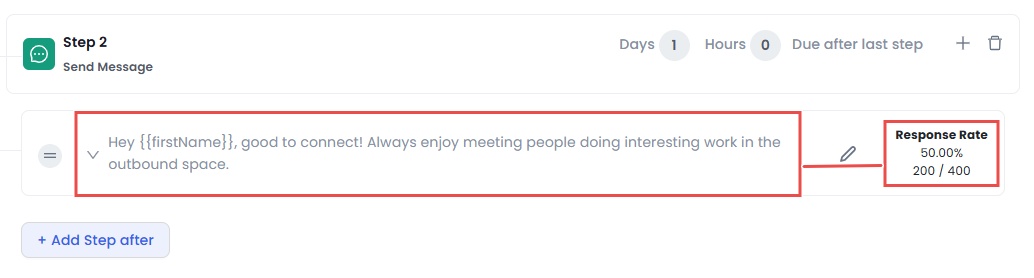
Message length. Shorter messages consistently outperform longer ones. Keep it under 400 characters wherever possible. The prospect is not going to read a paragraph from someone they just connected with.
Multi-step follow-up. Single messages leave a lot of replies on the table. Two to three follow-ups spaced 4-5 days apart is where most of the additional replies come from.
AI personalization per prospect. Generic templates get generic results. Writing a unique first line per prospect based on their profile, recent activity, or company news is the single biggest lever for message reply rate.
AI personalization per prospect means the AI reads each prospect's profile, recent activity, and company news and writes a unique opening line before the message goes out.
What Should You Do With These Benchmarks?
Benchmark Against Your Industry, Not the Platform Average
The platform average is the least useful number in this post. A SaaS company at 27% acceptance is on benchmark. A Recruiting firm at 27% is underperforming its peers. Same number, different story.
Figure out what your industry's baseline looks like and benchmark from there.
Stop Optimizing Variables That Don't Change Outcomes
Sender seniority and company size both fall into this category. If your team is spending time debating whether the CEO should send the requests, the data says it will not move the needle.
The variables worth spending time on: targeting quality, list segmentation, message structure, sequence length, follow-up timing, and warm-touch approach.
Move Investment From Connection Notes to Post-Connection Sequences
Note reply rates are declining. Message reply rates are stable. That is the clearest strategic signal here.
Build your pipeline around post-connection messaging. Use warm-touch sequences before the request to increase acceptance rates. Then run multi-step follow-up sequences after connection to give your reply rate multiple opportunities to work.
How Do SalesRobot Campaigns Compare to These Benchmarks?

Based on SalesRobot campaign data, message reply rates on post-connection sequences frequently hit 40-50%+ when AI variables are used alongside proper follow-up sequences.
The difference between average and top-performer results usually comes down to three things:
List quality, whether AI personalization is used, and whether the campaign runs a multi-step sequence or stops at one message.
SalesRobot's analytics dashboard shows acceptance rate, reply rate, and sequence performance broken down at the campaign level, so you can see exactly where you stand against these benchmarks in real time.
Start a free 14-day trial and run your first campaign.
Frequently Asked Questions
What is a good LinkedIn connection acceptance rate in 2026?
Anywhere between 28% and 35% is normal for most B2B outreach campaigns. Above 35% means your targeting and profile are in good shape. Below 20% is a signal to fix targeting or profile quality before scaling volume. The benchmark shifts by industry, so compare against your sector rather than the overall average.
What is a good LinkedIn message reply rate in 2026?
Good performance starts at around 35% for most industries. Top-performing campaigns hit 50%+ through tight targeting, AI personalization, and multi-step follow-up sequences. Below 15% usually signals a targeting or relevance issue rather than a copy problem.
Is the LinkedIn connection-note reply rate declining?
Yes. Note reply rates have been trending down consistently. The most likely cause is template saturation. Most senders are using similar notes, which means recipients recognize them as outreach and ignore them. The more reliable pipeline pathway is post-connection messaging, which has stayed stable.
Does sender seniority affect LinkedIn outreach performance?
Barely. C-level, Director, Manager, and Junior senders all land within a few percentage points of each other on acceptance rate. The variables that actually move results are targeting quality, message relevance, and sequence structure, not the sender's title.
Does company size affect LinkedIn outreach results?
No. Acceptance rates and reply rates are essentially flat across every company size. A small agency and a large enterprise running the same campaign to the same ICP will see similar results.
How many LinkedIn connection requests should I send per week?
LinkedIn's weekly limit is no longer a fixed number. It is reputation-based and adjusts based on your acceptance rate and account health. Start at 100-150 per week, track your acceptance rate against your industry benchmark, and scale from there once acceptance is holding above average.

Wow your leads by cloning yourself and sending personalized videos and voice notes to each lead on LinkedIn.
If you don't reply to leads within 5 mins, your chances of converting them fall by 50%. Our AI replies on your behalf instantly! (and yes, you can train it)

Don't shoot in the dark. Get detailed analytics on what's working
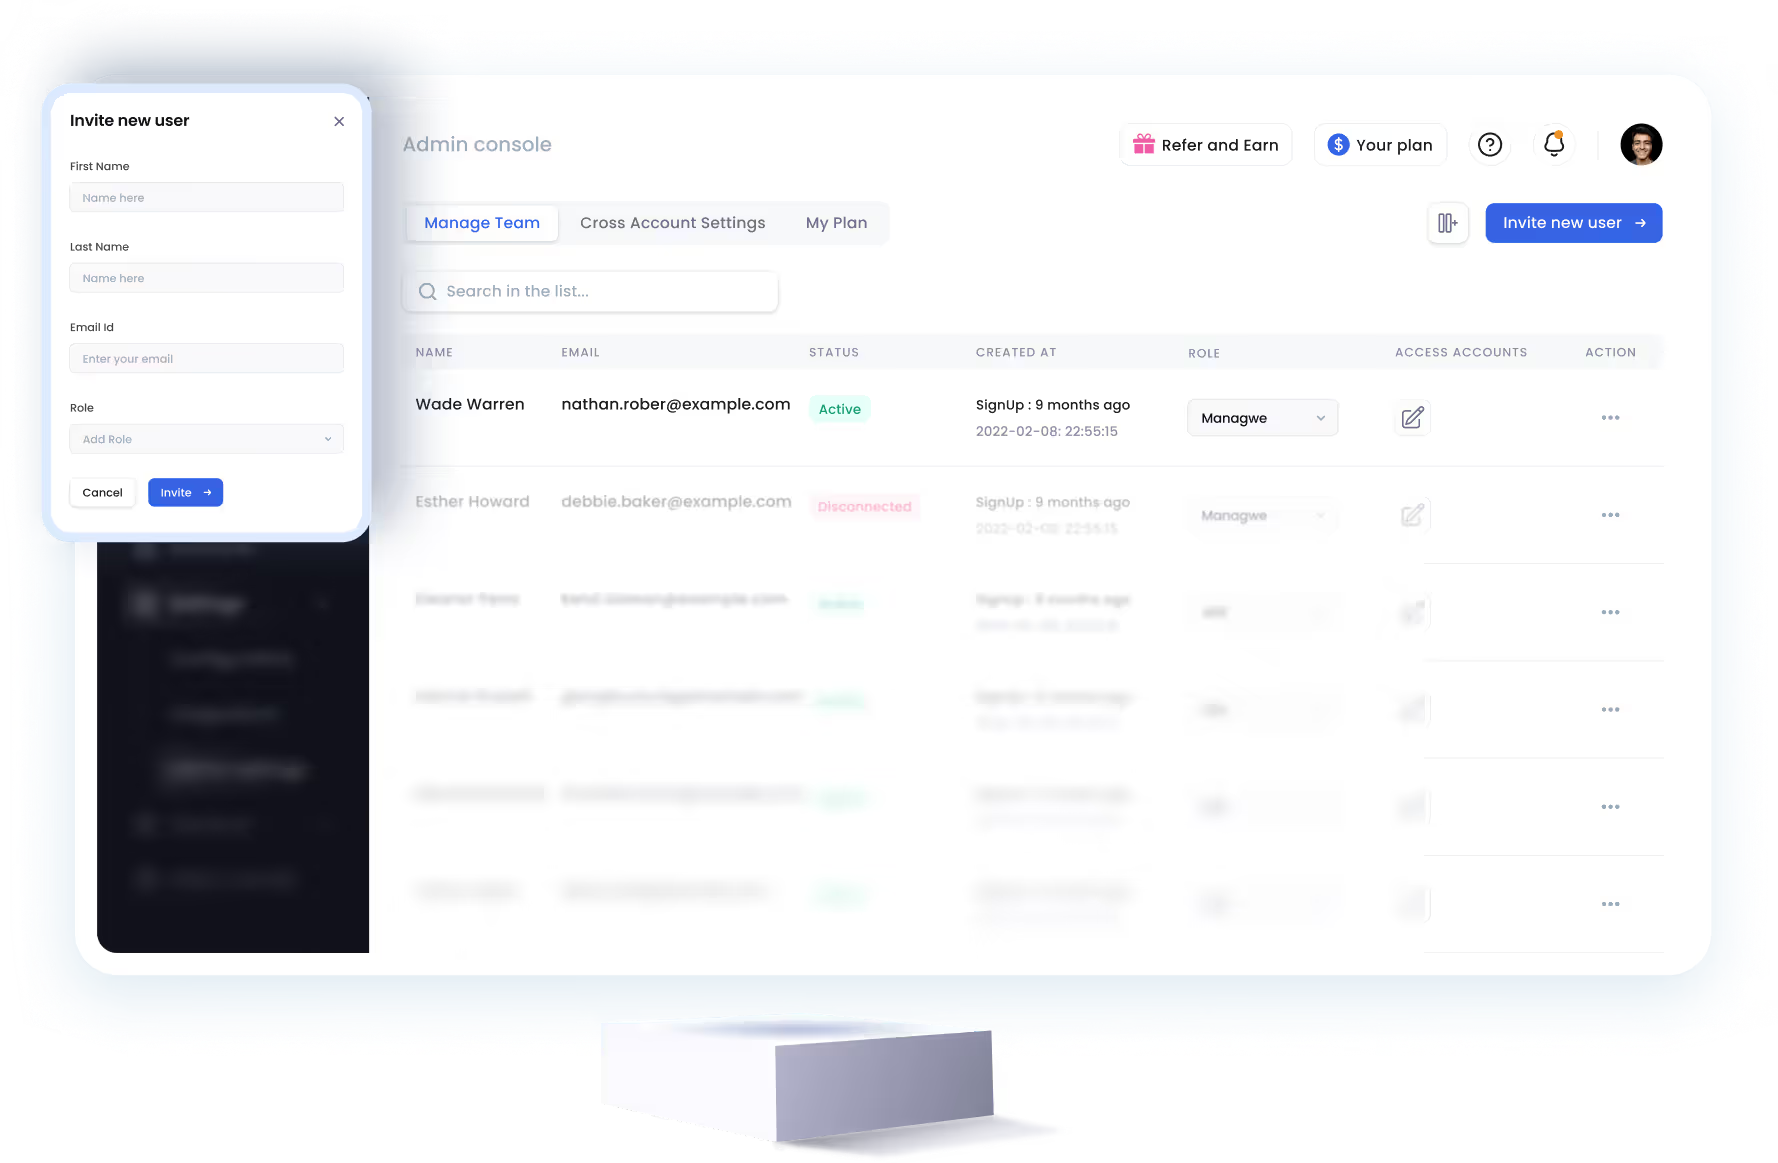
SalesRobot allows you to invite other team members, so that they can add their LinkedIn Account, run outreach campaigns and get amazing results just like you.
Trusted by 4100+ innovative B2B sales teams and lead gen agencies

.avif)

.avif)


.avif)


.avif)


